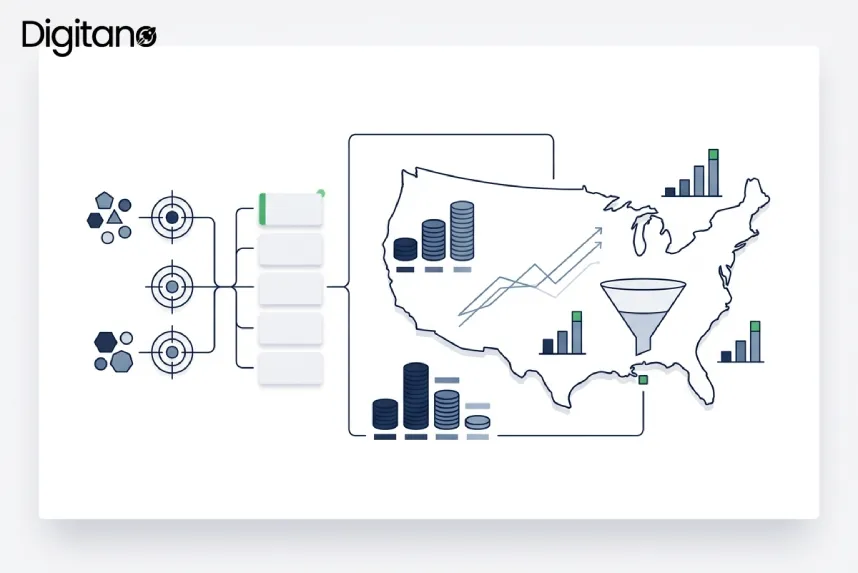
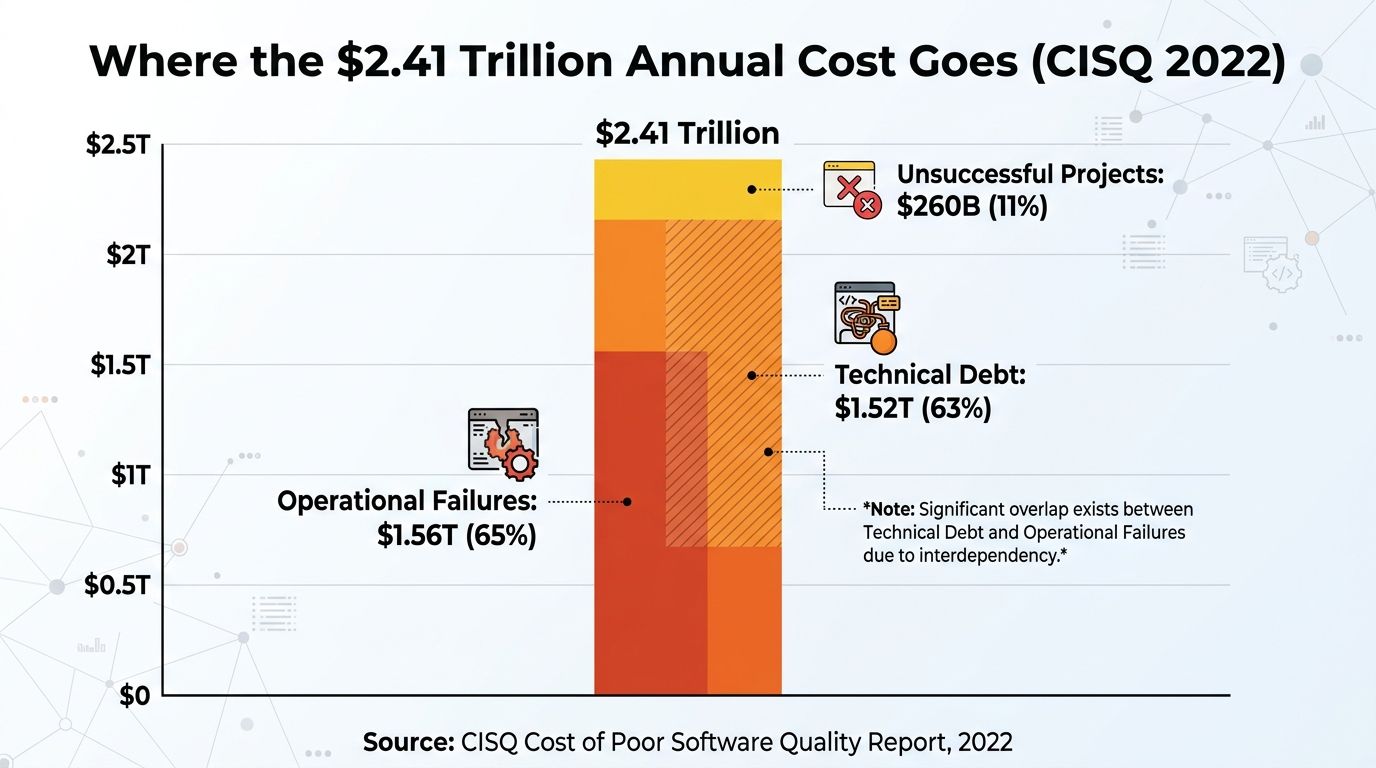
Let me put a number on the table that most engineering leaders don't fully register when they see it: $2.41 trillion. That's the annual cost of poor software quality in the United States alone, according to the Consortium for Information & Software Quality (CISQ), co-sponsored by the Software Engineering Institute at Carnegie Mellon University. To put that in perspective, it's nearly double the entire US federal budget deficit. It's more than the GDP of most countries. And it's roughly 40 times larger than the $59.5 billion NIST estimated the same problem cost in 2002. The cost of poor software quality hasn't just grown. It's exploded, because software now runs everything from your car to your bank to your hospital, and defects in any of those systems ripple through the entire economy.
This guide walks through exactly where that cost comes from, why defects get exponentially more expensive the later you find them, and the specific prevention strategies that actually work in 2026. If you'd rather have an experienced team help you build the quality workflows that catch these costs before they compound, our digital marketing services and consulting work at Digitano LLC include this kind of technical strategy for organizations serious about disciplined engineering.
The $2.41 Trillion Problem: What Poor Software Quality Actually Costs
Before we talk about prevention, let's ground the conversation in real numbers. Here's the CISQ 2022 breakdown that engineering leaders in 2026 still reference as the definitive benchmark:
- Operational software failures: $1.56 trillion: costs from system downtime, glitches, outages, and customer-facing incidents
- Unsuccessful development projects: $260 billion: total financial loss from software projects that get cancelled or fail to deliver their intended value
- Accumulated technical debt: $1.52 trillion: the future cost of rework caused by shortcuts and rushed decisions today
Total: $2.41 trillion annually in the US alone.
For individual companies, the picture is just as concerning:
- 45% of US businesses report annual losses above $5 million from poor software quality
- The average business loses over $1 million per year on software quality issues alone
- The average cost of a US data breach reached $9.44 million (IBM 2022 study, up from $9.05 million the previous year)
IBM's 2024 Cost of a Data Breach Report pegs the global average at $4.88 million, with detection taking 258 days on average
The problem isn't slowing down. Cybercrime losses due to software vulnerabilities rose 64% between 2020 and 2021, then another 42% from 2021 to 2022, based on data in the CISQ report. Every year that goes by, more systems depend on software, and every software defect has more potential to cascade into real financial damage.
The Cost Multiplier: Why Defects Get Exponentially More Expensive
This is the single most important concept in software economics, and it's been validated repeatedly since the 1970s. IBM's Systems Sciences Institute produced the original data that's now known as the "Rule of 100": the same defect costs dramatically different amounts depending on when you find it.
The multipliers:
- 1x to fix in the requirements/design phase
- 6.5x to fix during coding
- 15x to fix during testing
- 100x to fix in production
To make this concrete, let's use a real example. Say your team's average bug fix in the unit-test stage costs $500 in developer time (investigation, fix, re-test). Here's what that same defect costs at each later stage:
Stage Found | Multiplier | Approximate Cost |
|---|---|---|
| Requirements/Design | 1x | $77 |
Coding | 6.5x | $500 |
Integration testing | 15x | $1,150 |
System testing | 40x | $3,080 |
Production | 100x+ | $7,700 – $10,000+ |
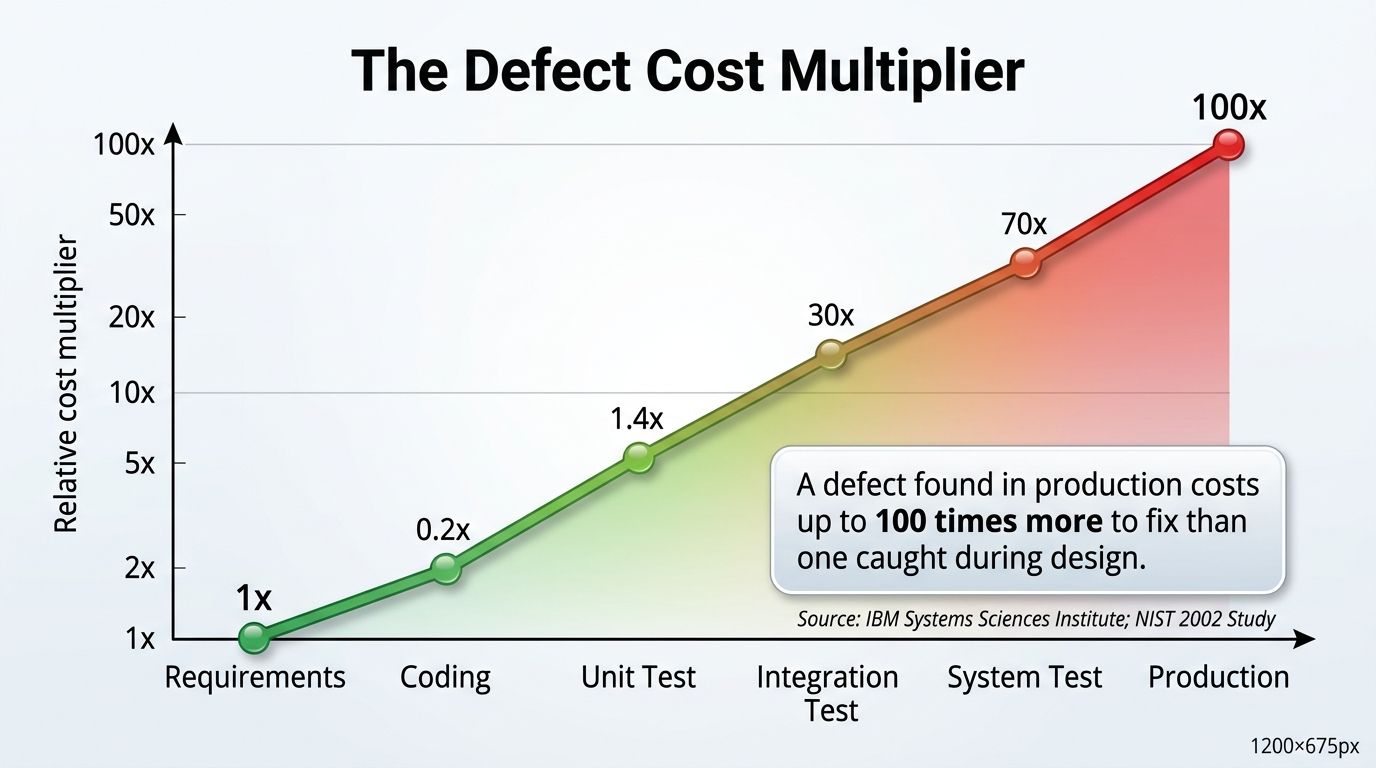
The reality for performance defects is even worse. When you factor in incident response, emergency patching, regression testing of the hotfix, deployment coordination, and potential SLA penalties, performance defects can exceed a 30x multiplier because remediation triggers additional infrastructure scaling costs and user churn that functional bugs typically don't.
And this doesn't even count the intangibles: engineering morale damage from constant firefighting, customer trust erosion, and the opportunity cost of your best engineers spending time on incident response instead of building new features.
Where the Cost Actually Hides in Your Business
Most engineering leaders think about poor software quality as "we have bugs to fix." The real cost is much broader. Quality problems hide in four buckets:
1. Prevention Costs
Investment in requirements reviews, coding standards, developer training, and quality tooling. This is the cheapest bucket to pay from, but most organizations underinvest here.
2. Appraisal Costs
Testing, code inspection, static analysis, and formal review activities. Also relatively cheap, but only if done early. Testing after code is written costs 15x more than testing during design.
3. Internal Failure Costs
Defects caught before release: rework, code refactoring, delayed launches, and blocked deployments. Expensive, but manageable.
4. External Failure Costs
Defects that reach customers: incident response, hotfixes, SLA penalties, customer support, refunds, reputation damage, and lost future revenue. This is where the multiplier explodes.
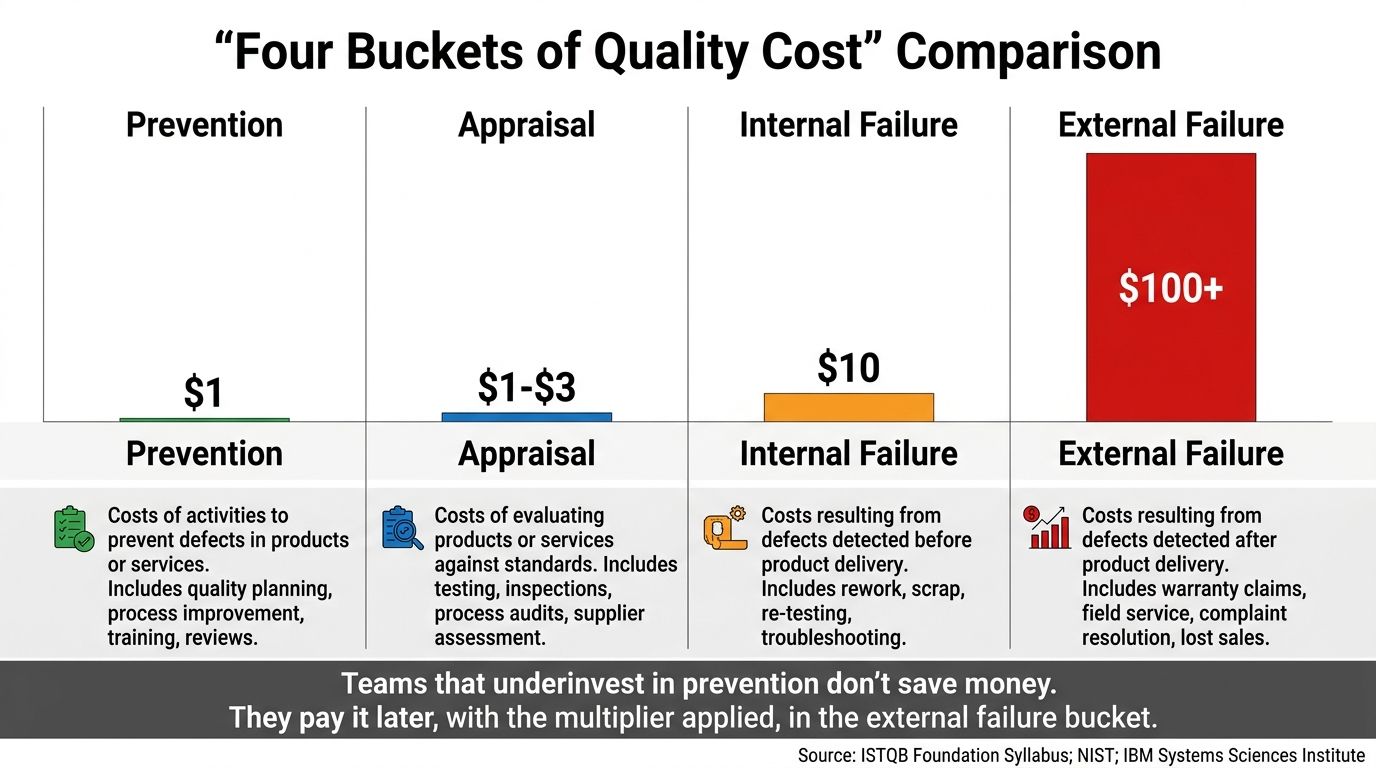
The economics are simple: a dollar spent on prevention removes roughly ten dollars of internal failure cost and a hundred dollars of external failure cost. Teams that skip prevention aren't saving money. They're deferring it to the most expensive bucket possible.
Real Company Examples: When Poor Software Quality Bites
Abstract statistics only tell part of the story. Here are documented cases where poor software quality created genuine business damage:
Knight Capital Group (2012, still cited as a textbook example)
A single deployment bug caused Knight Capital to lose approximately $440 million in 45 minutes. A software update went to seven of eight servers correctly, but the eighth ran old code that malfunctioned when new orders came through. The company was forced to sell itself at a discount within days. This is the extreme case, but it shows what a single production defect can do.
Boeing 737 MAX (2018-2019)
The MCAS software system, insufficiently tested against real-world edge cases, contributed to two fatal crashes. Direct financial impact to Boeing exceeded $20 billion in fines, settlements, grounded aircraft losses, and reputation damage. Reputational impact continues to affect the company in 2026.
Equifax (2017 breach)
A known vulnerability in Apache Struts, patchable but unpatched due to organizational failures, led to the exposure of 147 million people's data. Total costs including settlements, fines, and remediation exceeded $1.4 billion.
Southwest Airlines (2022 holiday meltdown)
Outdated crew scheduling software couldn't handle a winter storm's cascading disruptions. Southwest cancelled 16,700 flights in 10 days, with total costs estimated above $800 million. Root cause: technical debt in a system that had needed modernization for years.
These aren't outliers. They're what happens when the CISQ statistics play out at specific companies. The $2.41 trillion national total is the sum of thousands of these stories, most of which never make the news but still cost real money.
The Cost of Technical Debt: A Silent Killer
Technical debt gets special attention because it's the second-largest contributor to the $2.41 trillion figure at $1.52 trillion annually. The CISQ report identifies technical debt as the biggest obstacle to making code changes.
Here's the mechanism: quick fixes, rushed decisions, and workarounds pile up over time. Each individual shortcut seems cheap. Together they create code that's increasingly expensive to modify. Eventually, teams spend more time working around old decisions than building new features.
The compounding effect is real:
- Developers spend an average of 42% of their time dealing with technical debt-related issues
- Legacy system maintenance consumes 60-80% of total IT budgets at large enterprises
- Modernization projects fail at a 40-50% rate, often because the underlying tech debt is too deep to unwind cleanly
Technical debt doesn't announce itself. It shows up as "why does this simple change take three weeks?" or "why do we have three different authentication systems?" Both are symptoms of decisions made years ago that no one wants to touch now.
How to Prevent Poor Software Quality: 7 Strategies That Actually Work
Enough about the problem. Let's talk about what actually reduces these costs, based on what's genuinely working for teams in 2026.
Strategy 1: Shift Left Testing
The single highest-ROI strategy for reducing software quality costs. "Shift left" means moving quality activities (testing, security, validation) to earlier phases of the development lifecycle instead of leaving them until the end.
The measurable impact:
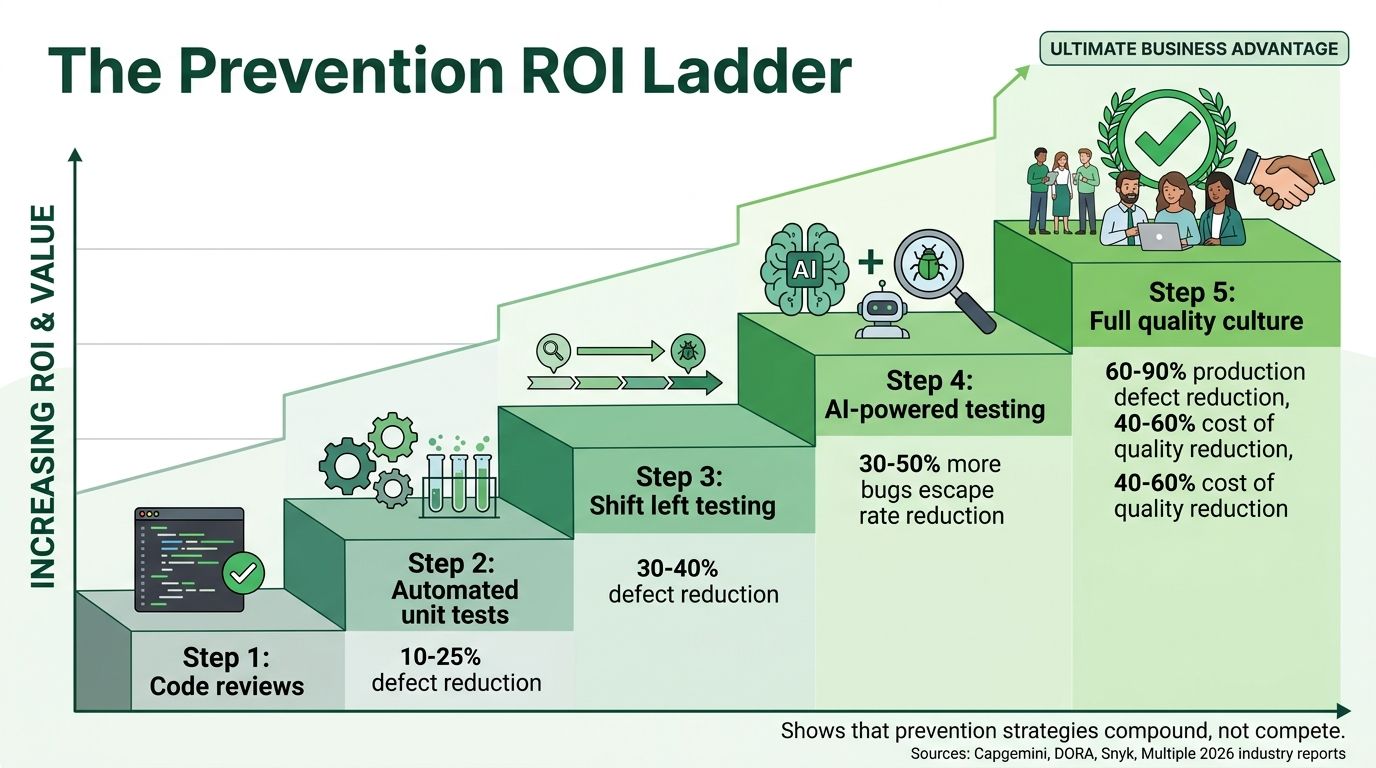
- Organizations in the top quartile of shift left maturity report 30-40% lower defect escape rates to production (Capgemini World Quality Report)
- 25-35% faster release cycles because less time is spent on incident response
- 60-90% reduction in production defects with mature shift left practices (multiple sources)
- 40-60% reduction in total cost of quality when properly implemented
Specifically, this means:
- Testers participate in requirements reviews, flagging ambiguity before code is written
- Developers write unit tests alongside features (TDD/BDD)
- Static analysis runs on every commit
- Security scanning happens in CI, not in a separate audit phase
- Performance testing happens in staging, not after production issues
Strategy 2: Automated Testing at Every Layer
The data on test automation ROI is overwhelming. Snyk's research shows security remediation costs drop from $9,500 in production to $1,400 when caught in CI. Similar ratios apply to functional defects, performance issues, and integration bugs.
The 2026 test automation adoption rate reached 58% (Capgemini World Quality Report), up from around 40% in 2023. Teams still relying primarily on manual testing are increasingly outliers.
Focus areas that matter most:
- Unit tests for core business logic
- Integration tests for critical workflows
- Contract tests for API boundaries
- End-to-end tests for the top 10-20 user journeys
- Performance and load tests for critical paths
- Security scans and dependency vulnerability checks
Strategy 3: Code Review Discipline
Peer code review is one of the most-studied defect-reduction practices, and the ROI is documented across decades of research. Every commit reviewed by a second engineer catches defects that automated tools miss.
The best-performing teams in 2026:
- Review 100% of commits before merge
- Have clear standards for what "approved" means
- Use tools like GitHub Copilot's review features to catch common issues before human review
- Track review turnaround time and quality metrics
Strategy 4: Continuous Integration and DORA Metrics
The DORA State of DevOps Report has repeatedly validated that four metrics separate high-performing engineering teams from low-performing ones:
- Deployment frequency: How often you ship (higher is better)
- Lead time for changes: How long from commit to production (shorter is better)
- Change failure rate: Percentage of deployments causing incidents (lower is better)
- Mean time to recovery (MTTR): How fast you recover from incidents (shorter is better)
Elite teams recover from production failures in under one hour, according to DORA. Low performers can take days or weeks. The difference isn't team skill. It's the maturity of their CI/CD, monitoring, and rollback capabilities.
Strategy 5: Technical Debt Management
Since technical debt is $1.52 trillion of the total cost, actively managing it produces meaningful ROI. Practical approaches:
- Dedicate 15-20% of engineering capacity to debt reduction each sprint
- Track debt in the same backlog as features, with cost estimates and impact scores
- Refactor incrementally as you touch code, not in big rewrites
- Say no to shortcuts on foundational components
- Modernize proactively before systems become unmaintainable, not after they fail
Strategy 6: AI-Powered Quality Tools
The 2026 rise of AI-powered testing, code review, and defect prediction tools is genuinely changing the economics of software quality. Real 2026 data:
- 67% of QA teams now use at least one AI-powered testing tool (up from 21% in 2024)
- AI test automation catches 30-50% more bugs than manual testing
- Self-healing tests reduce maintenance burden by 60-80%
- Total QA cost reductions of 40-60% for teams that integrate AI properly
Popular tool categories: AI test generation (Katalon, Mabl, testRigor), AI code review (GitHub Copilot, Claude Code), AI-powered visual testing (Applitools), and AI-driven defect prediction platforms.
Strategy 7: Quality Culture and Metrics That Matter
The tools and processes only work if the culture supports them. High-performing organizations share several traits:
- Quality is everyone's responsibility, not just QA's
- Blameless post-mortems for production incidents (focus on systems, not people)
- Real quality metrics (defect escape rate, MTTR, customer-reported defect rate) instead of vanity metrics
- Engineering leadership advocates for prevention investment even when timelines are tight
- QA participates in planning, not just execution
Real-World ROI: What Prevention Actually Saves
Let me put concrete numbers on this. Imagine a mid-sized US company with a 50-person engineering team, roughly $5M in annual software development costs. Based on industry averages, poor quality is likely costing this company $500K-$1M annually in rework, incidents, and lost productivity.
If they implement mature shift left practices, they could reasonably expect:
- $300K-$500K annual reduction in incident response costs
- $100K-$200K in avoided customer refunds and SLA penalties
- $150K-$250K in reclaimed engineering time from firefighting
- $50K-$100K in reduced technical debt maintenance
Conservative total: $600K-$1.05M in annual savings for implementation costs typically under $150K in tooling and training.
That's a 4-7x ROI in year one, and the returns compound as quality improvements build on each other.
Common Mistakes That Keep Costs High
Based on patterns from 2026 industry analysis:
- Underinvesting in prevention and appraisal. Teams that cut testing budgets when deadlines slip don't save money. They just move it to the external failure bucket at a 10-100x multiplier.
- Focusing on defect counts instead of defect escape rates. The number of bugs found isn't the metric. The number of bugs customers find is.
- Ignoring technical debt until it's a crisis. Debt compounds silently. By the time it demands attention, remediation costs are often 5-10x what proactive management would have cost.
- Treating QA as a phase, not a discipline. Quality assurance done as a final step catches 10-20% of what shift left catches.
- Skipping post-mortems on production incidents. Every incident that doesn't drive systemic improvement is likely to repeat.
- Buying tools without changing workflows. A test automation tool without a quality culture is expensive shelfware.
- Failing to measure what matters. DORA metrics, defect escape rate, and MTTR are the real quality indicators. Test count and code coverage are proxies at best.
Frequently Asked Questions
Q1: How much does poor software quality actually cost?
According to the Consortium for Information & Software Quality (CISQ), poor software quality costs the US economy approximately $2.41 trillion annually. This breaks down into $1.56 trillion in operational failures, $260 billion in unsuccessful projects, and $1.52 trillion in accumulated technical debt. For individual businesses, 45% of US companies report losses above $5 million annually from software quality issues.
Q2: What is the cost of a production bug?
A production defect costs approximately 100 times more to fix than the same defect caught in the requirements or design phase, based on IBM's Systems Sciences Institute research. In real dollars, if a bug costs $500 to fix at the unit-test stage, the same bug in production typically costs $7,700-$10,000+ when factoring in incident response, emergency patching, and customer impact. Performance defects can exceed a 30x multiplier due to infrastructure and churn costs.
Q3: What is shift left testing and how does it save money?
Shift left testing means moving quality activities (testing, security scanning, validation) to earlier phases of the software development lifecycle. Organizations in the top quartile of shift left maturity report 30-40% lower defect escape rates to production and 25-35% faster release cycles. Mature shift left programs reduce production defects by 60-90% and cut total cost of quality by 40-60%.
Q4: How do I reduce technical debt without stopping feature work?
Dedicate 15-20% of engineering capacity to debt reduction each sprint, track debt in the same backlog as features with impact scores, refactor incrementally as you touch code (not in big rewrites), and modernize proactively before systems become unmaintainable. The teams that successfully manage debt do so continuously, not in emergency projects.
Q5: What are the most important software quality metrics?
DORA's four key metrics: deployment frequency, lead time for changes, change failure rate, and mean time to recovery. Beyond DORA, defect escape rate (percentage of bugs found by customers vs. internal teams), mean time to detect production issues, and customer-reported defect rate are the metrics that separate high-performing engineering organizations from low-performing ones.
Q6: Is AI-powered testing worth the investment?
For most teams in 2026, yes. AI test automation catches 30-50% more bugs than manual testing, self-healing tests reduce maintenance burden by 60-80%, and total QA cost reductions of 40-60% are common when AI is integrated properly. However, AI tools require the same discipline as any other quality practice, human review, clear success metrics, and integration into existing workflows. Bolting AI onto broken processes doesn't fix them.
The Bottom Line
The $2.41 trillion annual cost of poor software quality in the US isn't an abstract statistic. It's the sum of thousands of production incidents, cancelled projects, and accumulated technical debt across every industry that depends on software. For your organization, the question isn't whether you're paying part of that cost. You almost certainly are. The question is whether you're paying it in the cheap buckets (prevention and appraisal) or the expensive ones (internal and external failure).
The teams that get this right don't treat quality as a cost center. They treat it as a compounding investment. Every dollar spent on prevention prevents roughly ten dollars of internal failure cost and a hundred dollars of external failure cost. Every automated test that catches a bug in CI saves the multiplied cost of that bug in production. Every shift left practice reduces incident response time and lets engineers focus on building instead of firefighting.
Preventing poor software quality isn't about hiring more QA testers or buying more tools. It's about building disciplined engineering practices, investing in the right stages of the development lifecycle, and creating a culture where quality is everyone's responsibility. The economics are unambiguous. The teams that treat quality this way in 2026 are meaningfully outperforming teams that don't.
For organizations that need help building the quality workflows, testing strategies, or engineering culture that turns these principles into real cost savings, contact Digitano LLC. We help engineering teams move from reactive firefighting into disciplined, measurable quality practices that reduce the real cost of poor software before it compounds into production incidents and technical debt.